|
Software
review
|

|
|
HFProp
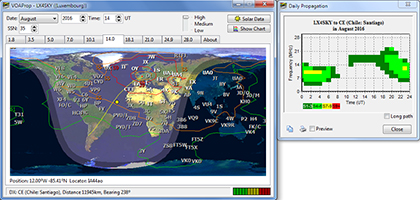
1.3 main window. |
HFProp
propagation analysis and prediction program
Foreword.
This review was written in 2004 for versions 1.2 and 1.3. Today these versions
have been replaced by VOAProp
that uses the VOACAP engine. It shows the same look and feel, and you
can download it free of charge on G4ILO's website.
Developed
by Julian Moss, G4ILO, HFProp is a quite simple propagation
program that gives you quickly propagation estimations.
Before
1995 there was several free propagation prediction programs written
in GWBasic, such as MiniMUF and MaxiMUF. However, the only free programs
available for Windows were not very easy to use and took a lot of effort
to produce a prediction for one particular path or circuit (point-to-point method).
In
the end, Julian Moss wrote his own Windows application based on an old
GWBasic code that he developed earlier. Then he began tweaking the algorithms
to make them better approximate the results of other more complex programs.
As
he told himself, he was never completely satisfied with the results
and after a while he gave up the idea to optimize his application.
Recently, he rediscovered
his program and started to play with it again. He tidied up a few things,
tweaked the algorithms a bit more, and added a few new features to
eventually release in 2003 a version 1.2 and a faster version 1.3 in
2004.
HFProp
does not use any IONCAP, VOACAP or down-sized IRI model of the
ionosphere; it is much simpler than this. It works essentially with
an algorithm based on the F-layer model developed by Raymond Fricker
of the BBC, a well-known algorithm already used in DOS programs like Miniprop
or DXaid in the late '90s. It is completed with a
geomagnetic model that predicts effects of the K-index at high
latitudes.
Your
propagation estimation in a few seconds
Positive
side, highlight several points. First only a few seconds are
necessary to generate a prediction map. Then, contrarily to other
applications, HFProp asks explicitely for A- and K-index values and
provides an automatic SFI to SSN converter. Unlike other programs,
it shows no error in drawing short and long paths. Even very close
to the frame and at 90° from your home location (e.g. near ZL at 39°S
and 179°W by the long path) the path follows strictly geodesics and
doesn't show erratic trajectories, steep angle and steps like some
of its competitors.
|

|
|
HFProp
1.2 uses a nice cartesian world map highlighting cities plunged
into darkness, on which is displayed the gray line and all
accessible countries for a specified band, time and day. In addition
I request to show the short path to
Taiwan (BV) and get the bearing and his signal strength to
the receiver. Clicking on the map, a MUF/LUF window poped up
to display additional information. |
That
said, HFProp is much simpler to setup and to use that a program using a
VOACAP engine. And I bet that most of you are not ready to spend
minutes behind their screen to set a prediction that eventually will
maybe not reflect your real working conditions. In this
case HFProp is made or you, or almost !
HFProp
deserves a try for several reasons. First it is free. Then
contrarily to many other propagation prediction programs, it displays
the MUF, LUF and critical frequencies (E and F2) using
iso-contour maps incrusted in a gray line cartesian map of
the world instead or line, bar graphs or text reports. In
this way you see for example immediately the
"ionization islands" along the equatorial anomaly
and, correlated with the prediction for a specific band, you
can estimate your chance to work such or such country,
although the reliability is in the average.
In
addition, in each band, in "DXer mode" in which
the accuracy is best (this is a cursor
to move) HFProp displays all
entities (prefixes) accessible under the specified
conditions. The intensity of each prefix varies according to
the signal strength (white to gray). In addition, clicking
on a location, an indicator located below right displays the
signal strength in form of green and red LEDs.
This map is self-explanatory and easy to use because there
is no need to clic on the image to get a
propagation chart like in other programs. If you do it, a new window pops up
showing together the MUF and LUF variation to that remote
station as displayed at left. However this map does not take
into account the reliability or the antenna receive
properties.
HFProp
also includes a beacon tracker (offline simulation) as accurate
as the one of its competitors that displays also their
estimated signal strength.
At
last in the new version 1.3, G4ILO added a link to the Internet. You
can type any URL and get online data like WWV
messages. In addition it included an automatic updater to get
current solar flux and K index. In the new
version 1.3, the two critical frequency charts for E and F2 layers
are not displayed by default, but can be enabled (as can maps for
other bands, including broadcast bands) by right-clicking the map
and selecting "Set visible tabs". The version 1.3 is also
became a "donationware"; as long as you don't donate some
money to encourage Julian to develop his program, an
"unregistered" message will be displayed on top of the
screen.
Accuracy
of forecasts
What can we expect from HFProp forecasts ? How does it perform against its competitors ?
All depends on your needs. Programs using the VOACAP model to name
the reference program are surely more more accurate
and complete than HFProp but they also request more effort and are
often difficult to master at first sight due to the definition of
all parameters of a communication
circuit. If HPprop is able to display a forecast in 5 seconds,
VOACAP requests one minute or more if you master the program.
On
his side, Julian
is not sure that propagation forecasts can ever be very accurate,
however complex the model : "trying to predict ionospheric
conditions based on just two variables which were measured a few
hours earlier is like trying to forecast the weather given just the
temperature and humidity. Therefore I'm not convinced that lengthy,
highly accurate calculations are necessarily worth the time they
take".
It
is a fact that HFProp uses very few variables compared to the ones included
in a VOACAP model : 6 vs. 30.... HFProp ignores for example specifications of both
transmitter and receiver terminals (antenna gain, power, takeoff
angle, etc), it doesn't check ground properties (the
good influence of the sea for example) or the change in propagation
along the gray line. At last it doesn't take into account the noise
level at receive, hop structure, S/I, S/N reliability, required reliability or the multipath
tolerance to name most important parameters available in the VOACAP model.
By design, its predictions cannot thus show the same accuracy as a VOACAP-based
application.
Its
results are displayed at the global earth scale with a geographical
accuracy close to 5°. Only the MUF/LUF chart can be predicted for a
specified circuit, between your home and a target location.
HFProp
works with statistical values, offline, and displays thus some difference
over other programs when calculating the propagation to a DX station, or it does rough
assumptions. In a sense it is an advantage because it gives you quickly an idea of the best
times and frequencies for DXing what could be the other influences. But
this method has also some drawbacks.
Most
of the time if you work a DX station placed in the middle of the
coverage, where usually the reliability is the highest, but not
always, you will get the result that you expect (if at least amateurs are QRV in that
remote country, Hi!). But consider the prediction displayed on the iso-contour
frequency map or call signs incrusted as representing a rought
estimation, a global view of the expected propagation conditions. Or said in other words, data
displayed are not entirely reliable because the system is not able
to calculate this reliability; it has no input data and no function to make this
forecast or it assumes the highest value, what is not often realistic.
Take
an example. Working on the air I am sure that you have already been the
witness of a sudden 20-meter band closing down in the afternoon although
it was wide open a few minutes earlier or a 40-meter band with deep QSB and
noise during the morning. Both events are usually correlated with
either secundary effects of a large sunflare with an increasing
of planetary indices, a high LUF at daytime or even the darkness
when you work close to the gray line. How HFProp handles these
effects ?
 |
 |
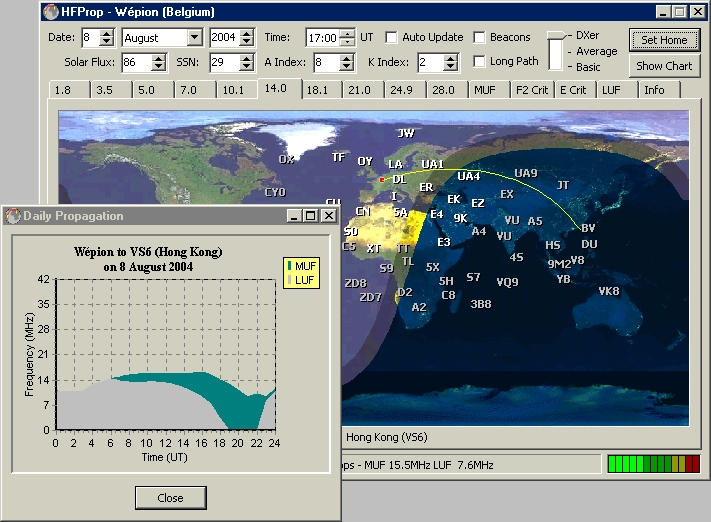
HFProp,
like many similar programs, has limited prediction
means. On the 40-m band for example at 0700 UTC at
summertime, from a home location in ON, it displays a
propagation chart extending over all western Europe
including Newfoundland (VO1) with a good signal (at
left). In fact in the field the propagation extended
to Brazil also. The LUF was predicted to increase in
frequency and at that time should exceed 7 MHz to
reach 10 MHz at noon. Three hours later the band was
predicted so closed that only the "DL"
prefix was displayed (at right). In the field the
propagation weakening as forecasted, and at short
distance there was strong fading and noise during
hours due to the LUF placed quite high. However, at
1000 UTC (right map) or even at noon, England, South
France, Italy and even Yugoslavia that was placed
where the LUF was predicted at 10 MHz where always
reachable, but with noise. So the left prediction was
also valid three to five hours later contrarily to its
calculations. Worst, as usual, used without additional
charts, the single MUF/LUFchart gave misleaded
information.
|
|
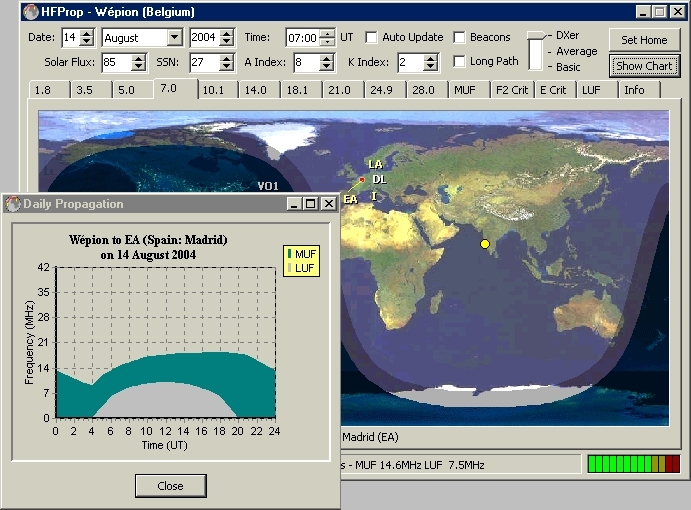
Working
offline with rather simple models, disturbances cannot be
forecasted by HFProp, all the less when default values are placed
much too high. I tried for example to know what reliability factor
used the LUF algorithm that seemed to give a too high LUF forecast.
I used the ICEPAC then the VOACAP model and a complete circuit
between Brussels and Paris, path along which we experimented a
strong QSB over 6 S-points
and a LUF at 10 MHz by noon. It appeared that
the reliability was set to a value that even broadcasts do not use :
to get a LUF as high I had to set both Circuit reliability and S/N
reliability over 95% where amateurs usually set a SNR of 50% or even
less in CW mode. Even with this value I never exceed a LUF of 8.7
MHz, and even so the reliability was not met. In fact the real SNR
at noon was 38%, thus fair signals, and the LUF was never higher
than 4 MHz. The high reliability used by default by HFProp affected
thus the LUF estimation and all the propagation forecast.
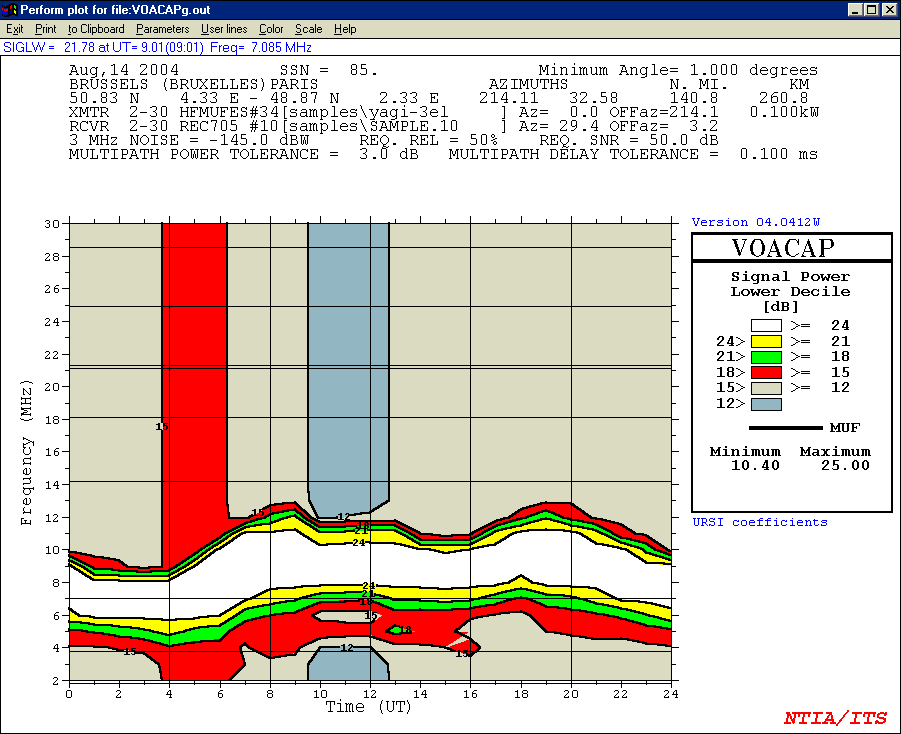
More
interesting, the VOACAP model gave a signal
power lower decile (taking into account the signal strength and
loss) on the 40-m band decreasing gradually up to 6 dB around 0900 UTC, just when I worked
these stations. Working with statistical values, these charts and
figures must be interpreted with care and well cross-checked with
other parameters. But in all cases this power loss of 75% (6 dB) represents
a receive power dropping from 100W to less than... 25W. This is less
than the the signal loss that I experimented, but it matches with
the time at which all amateurs and I experimented a strong QSB on
bands (of short period not shown in the chart) extending over tens of minutes
that was impossible to forecast in HFProp. The same event, but
inverted, occured by 2000 UTC and was correlated with a signal
increase. But don't worry, if VOACAP predicted these fluctuations,
HFProp is in the average; many other programs, even more expensive
or sophisticated, are no more able to foresee these disturbances.
If
HFprop doesn't work with many ionospheric models, it used in spite
of everything Fricker's F-layer model and a geomagnetic model to
take into account disturbed conditions. If HFProp is unable to foresee
and to show you explicitely a short opening, fading, a
disturbance (SID) or a polar absorption (PCA), it is however able to
tell you that such or such area is unreachable due to the
geomagnetic storm. In fact it doesn't tell you that explicitely but
it removes all entity prefixes over the concerned area when K
exceeds 5 or so.
In the field you will see that
HFProp predictions are often too tight and pessimistic. But it is clear that using
a handful variables injected in an basic ionospheric model, such
a program cannot gives you very accurate predictions, all the less
using offline statistical data, interpolations and knowing that
ionospheric layers evolve, vanishing or consolidating in some tens
of minutes, sometimes faster a the lowest level. HFProp is able to
"find" the LUF increasing due to the sun presence
for example but never the QSB lost in its inaccuracies.
From
my trials and comparisons made with other propagation programs using
or not a VOACAP engine, the error can exceed 6 hours in the time estimation, about 2 MHz in frequency
and about 5000 km for the propagation chart (grayline map with
incrusted call signs). Taken independently or even all
together, these errors can easily lead to miss a DX station because the
band closed earlier than expected or because the opening will only
occur a few hours later, without speaking of the other parameters
simply ignored by the system.
My
final impression
|
|
|
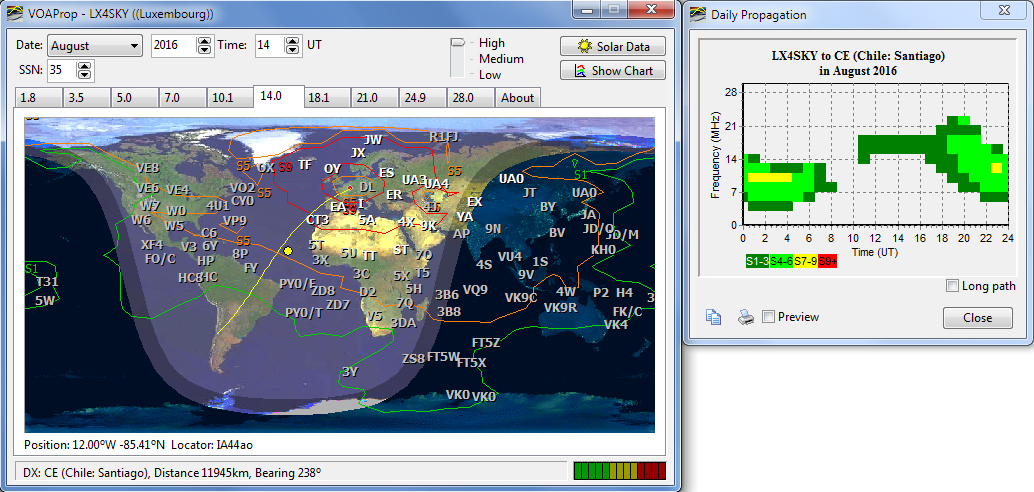
Interface
of VOAProp remplacing HFProp since 2004. |
Some
authors stated that forecasts provided by HFProp come close to
predictions calculated by the IONCAP model. Personally, I have
doubts about its ability to get the same accuracy as a
program using a more complete ionospheric model and numerous
parameters. Don't forget either that IONCAP (today replaced by VOACAP and other
tools) is able to provide long-term availability figures, SNR and
other reliability, as many output parameters unknown from HFProp. Hard to
compare apples and pears in such conditions. The difference between
forecasts established by the first over the second are thus obvious,
especially when you compare their respective estimations for beacons,
easily comparable between programs as they are always on the air at
the same location and frequency.
For
short, don't trust in HFProp forecasts with more than 50% of
confidence, even though. Like many other programs,
using very few algorithms, HFProp only make rough estimations using
a very simple ionospheric model and an unrealistic reliability. Consequently, at one occasion the DX country
displayed will be unreadable, at another occasion you will reach or
hear a country 5000 km further that predicted. This result is thus
still worse than having a 50-50 chance to work or not a DX station.
So,
all well considered, HFProp has minuses and pluses. Globally, thanks to
its nice world map based on satellite images and a user-friendly
interface, the product is attracting at first look. Thanks to its original
approach using iso-contour maps and incrusted data, HFProp
can give you "the big picture" but it is soiled with a
serious estimation error. Using a too simple model, it is unable to estimate
whether a QSO is possible or not under the specified conditions, what at the end is the essential.
Now,
if you only want to know in what direction to bear your antenna or
if a "summary" map is all you request, go with it.
For
more information
HFProp
is free but no more available (but you can download version
1.3 from this site). Since 2004, this product has been replaced by VOAProp
v1.1 that uses the VOACAP engine, and than you can download from G4ILO's
website. The last corrections were made in 2008. The last version (2015) of the VOACAP engine can be
downloaded from Greg
Hand's website.
Back
to Menu
|


